This section begins with a general introduction to the DPSIR framework within mDSS, followed by an overview of the Catalogue of DPSIR Indicators and the Catalogue of Options. It provides a step-by-step guide specifically designed to successfully complete the Concept phase and transition smoothly into the Design phase.
The sequence of actions in the Concept phase may vary slightly depending on the chosen procedure option: MCA, MSS, or MSA. For MSS and MSA, certain steps from the Design phase must be carried out concurrently with the Concept phase.
The DPSIR Framework
The Concept phase is based on the Driving Force-Pressure-State-Impact-Response (DPSIR) framework. This tool facilitates the conceptualization of the problem, outlining the options and defining the indicators used to evaluate them during the analysis. The experiences gained by using the earlier versions of the software confirmed the potential of the DPSIR approach.
When a new or existing project is opened, the DPSIR window automatically appears in both the MCA and MSS cases. In the MSA case, however, an additional intermediate step is required to generate a graphical visualization of the completed framework, as explained in the following paragraphs.
Despite these variations, the core task in this phase remains consistent across all three cases: the user must conceptualize the problem by linking the necessary indicators for quantitative analysis to the corresponding DPSIR nodes and creating a schematic representation of the causal relationships between the different variables.
The nodes of the DPSIR framework are implemented as buttons. By clicking on the “Driving Force”, “Pressure”, “State”, “Impact”, or “Response” buttons the user can move them across the frame, to improve the quality of the graphical representation, in particular when it becomes crowded with long lists of indicators and links. Further options can be accessed by right-clicking on any of the “Driving Force,” “Pressure,” “State,” or “Impact” buttons. Clicking on “Catalogue of DPSIR Indicators”, users can compile or edit indicators within the Indicator Window (refer to the following sections for more details). Within this window, the indicators are categorized into four groups: Driving Force (D), Pressure (P), State (S), and Impact (I).
Similarly, the alternative options are linked to the Response button. Right-clicking on the “Response” button itself allows the user to open both the Catalogue of Response Measures and the Catalogue of DPSIR Indicators. Right-clicking on an option’s name opens a window displaying the specific details of that option.
As in other windows of mDSS, the user can quickly access the corresponding chapter of the User Manual by clicking the blue button with the white question mark in the upper-left corner of the window.
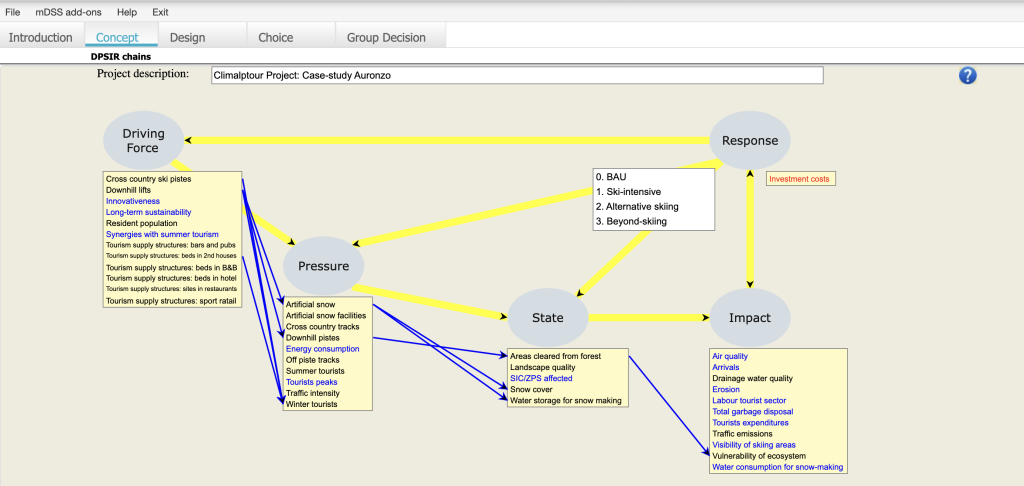
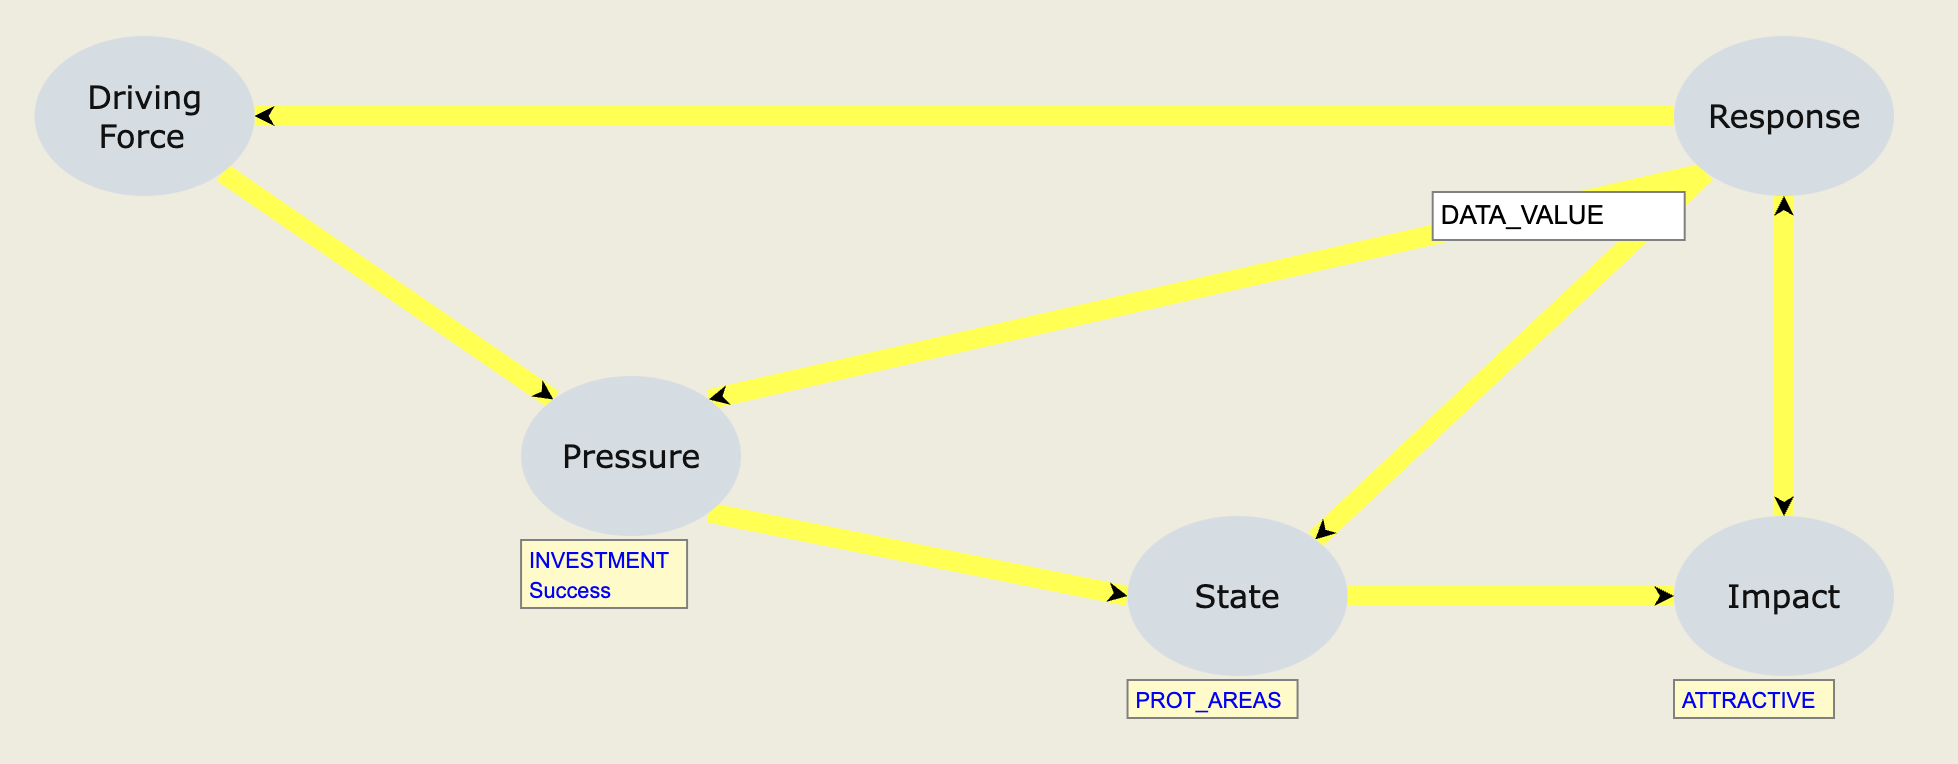
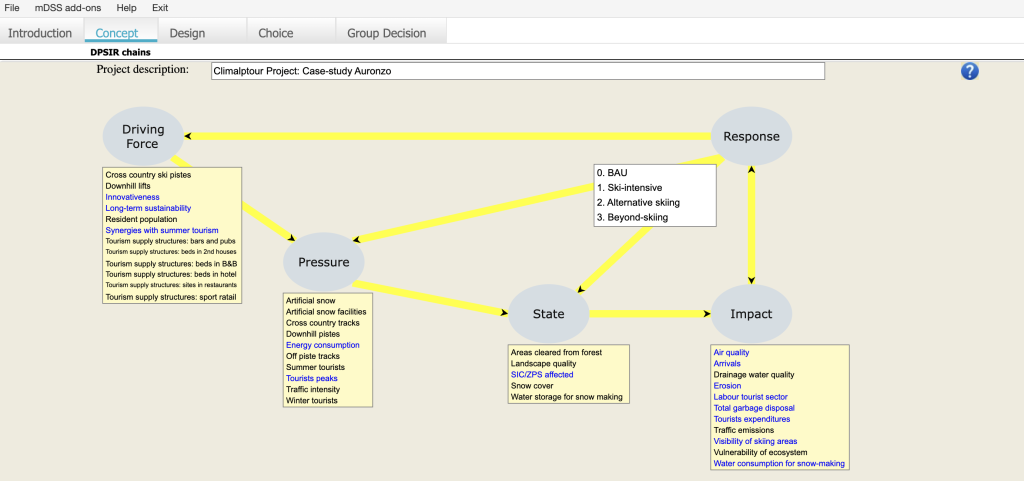
Figure 8 depicts the final window of the DPSIR framework applied to the Auronzo di Cadore case study. In this simple (scalar) scenario, the project’s considered options (Responses), defined at the beginning of the Design phase, are BAU (Business As Usual), Ski-intensive, Alternative skiing, and Beyond-skiing. These options are assessed based on the criteria outlined in the DPSI nodes, with the quantitative analysis focusing only on the blue indicators—those sent to the Analysis Matrix (AM).
Figure 8 also demonstrates the Link feature, showing a connection between the Pressure Indicator “Artificial snow” and the State Indicator “Snow cover.” This feature in mDSS helps enhance users’ understanding and conceptualization of the problem being analyzed, even though it does not have a direct impact on subsequent quantitative analysis.
By right-clicking instead on a selected indicator, the user can:
- See the indicator’s details (“Show indicator details”);
- Add (“Add link”) and remove (“Remove link”) links between indicators;
- Isolate the DPSI chains to which the selected indicator belongs (“Show related ’indicator’ links”), or show only the indicators related to the one selected in the other lists (“Show only related ’indicator’ links”).
- Delete “X” item
By right-clicking on one of the DPSIR arrows, a menu of options is activated, including:
- Show all indicators and links;
- Show all indicators;
- Show only chains from which no indicator has been sent to AM;
- Load indicators’ values (from an existing catalogue);
- Save all indicators’ values (to a new catalogue);
- Save image as jpg;
The Catalogue of Indicators
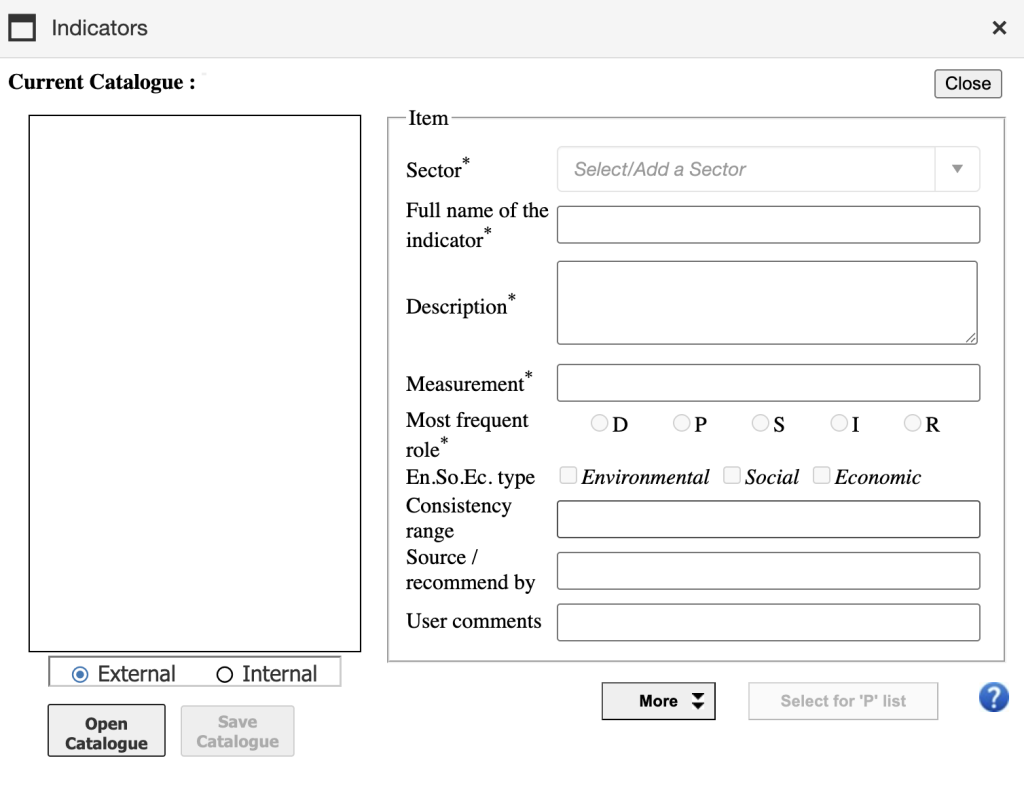
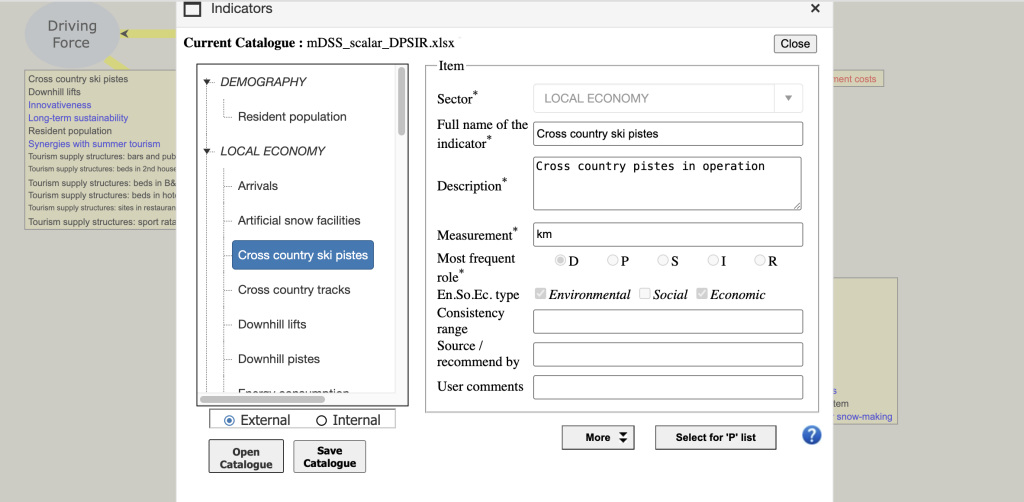
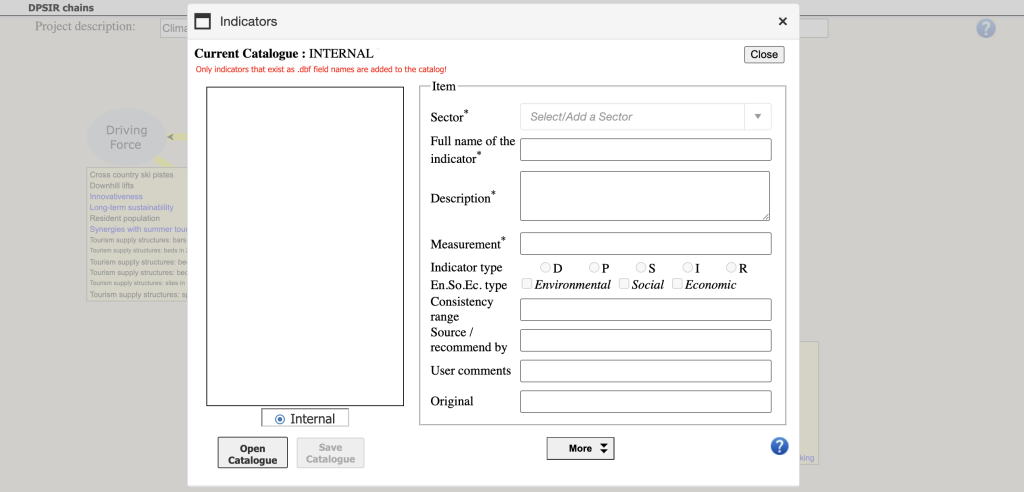
As stated before, right-clicking on the Driving Force, Pressure, State, or Impact buttons allows the user to open the Indicators Window. The Indicators Window (Figure 9) enables users to upload, create, and view the Catalogue of DPSIR Indicators. This catalogue offers a comprehensive list of relevant indicators to assess the problem and support decision-making during the working session. Each indicator is accompanied by detailed information, such as its unit of measure, to enhance understanding and facilitate informed choices. This catalogue is specifically designed to support a comprehensive evaluation of the problem at hand within the DPSIR framework (Driving Force, Pressure, State, Impact, and Response).
In mDSS, indicators are organized into two types of catalogues:
- External
- Internal
External catalogues are not tied to any specific project; instead, they contain a broad range of indicators that can be selected to create a customized list for a particular project. The indicators chosen by the user for the analysis are placed in the Internal Catalogue, which is specific to the project at hand.
For example, a policymaker specializing in ecosystem restoration may possess a comprehensive and diverse collection of indicators, developed over years of workshops with a wide range of stakeholders. For each case study, they can select the most relevant indicators for the specific ecosystem in mDSS, creating a customized internal catalogue that aligns with the unique needs of the project.
External Catalogues
In the Indicator Window, once the External Catalogue option is checked, the user can perform various actions, such as creating a new external catalogue, opening and modifying an existing one, editing indicator details, and sending indicators to the Internal Catalogue.
To create a new External Catalogue, the user should click the “More” button and then select “New Catalogue” from the options that appear. In the upper part of the window, the text “Current Catalogue: undefined” will be displayed.
To add an Indicator (Item) to this new catalogue, the user must click the “New Item” button and enter the relevant details. For each indicator, the user should define the Sector (the macro area linked to the indicator i.e. Natural Resources, Local Economy, and so on), a brief description, the measurement unit, the most frequent role in the DPSIR chain, the link with one of the three different dimensions of sustainable development (Social, Environmental, Economic), the catalogue of provenience, some user’s comments, and the possible source. The consistency range refers to the interval of values that can be correct for a certain indicator. At least the first four fields (i.e. the sector, full name, description, and unit) and the most frequent role played by the indicator must be specified in order to be able to save a new indicator. These mandatory fields are marked with an asterisk (*).
Once all required fields are completed, clicking “Save Item” will add the Indicator to the Catalogue, and it will appear on the screen.
Notably, the Catalogue of Indicators does not include the numerical values of each indicator for the various options to be evaluated. Its purpose is solely to provide a list and a description of the indicators used in the analysis. The assignment of quantitative values to these indicators, depending on the chosen analytical method, represents an additional distinct step in the process.
To delete an Indicator from the External Catalogue, the user should click the “More” button, select the name of the Indicator, and then click “Delete Item”.
The user can also modify the details of an Indicator. To do so, they need to open the “More” window, select the Indicator, update the relevant information, and save the changes by clicking “Save Item”.
Note: If the “Full name of the indicator” field is changed, clicking “Save Item” will create a copy of the Indicator with the modified name. Therefore, if the user wishes to rename an Indicator, they should ensure that they delete the old version after completing this procedure.
By clicking on the “More” button the user can also analyze the list of indicators with simple queries using logical functionalities (“and”/“or”), including or not the selected indicator.
To add indicators from the External Catalogue to the Internal Catalogue, first select the desired indicator from the left-side list in the Indicator Window, then click the “Select for X list” button. The value of “X” can be D, P, S, I or R, depending on the node where the user opens the Indicator Window by right-clicking. For example, if the user double-clicks on the “Pressure” node and selects the “Artificial Snow” indicator, clicking the “Select for P list” button will add that indicator to the Pressure list in the Internal Catalogue (Figure 10). If the user wishes to send an indicator to a different DPSIR node, they simply need to right-click on the desired node and open the Indicator Window from there.
Once the External Catalogue is complete, the user can download it by clicking the “Save Catalogue” button. It will be saved in XLSX format, allowing for further modifications in external programs such as Excel.
Instead of repeating the entire catalogue creation process for each session, the user can simply upload a locally stored catalogue in XLSX format by clicking the “Open Catalogue” button. Once uploaded, all previously mentioned operations—such as modifying item details, deleting elements, and sending indicators to the internal catalogue—remain available.
Internal Catalogues
In the Indicator Window, once the Internal Catalogue option is checked, the user can visualize the list of all the indicators selected from the External Catalogue. These Items represent the subset of the criteria that will be considered for the multicriteria analysis.
The user can save the internal catalog by clicking “Save Catalogue,” or upload a locally stored XLSX catalogue by selecting “Open Catalogue“.
To modify an item’s detail, simply click the “More” button, select the item’s name, make the desired changes, and click “Update” to confirm the changes.
The Catalogue of Response Measures
Right-clicking on the “Response” button opens the Catalogue of Response Measures window, where alternative measures are displayed (Figure 11). Defining the various alternatives to be evaluated is considered the first step in the Design phase, although this step may be closely linked to the Conceptual phase due to practical software requirements. In any case, the specific steps for each analysis method (MCA, MSS and MSA) will be outlined in the following section.
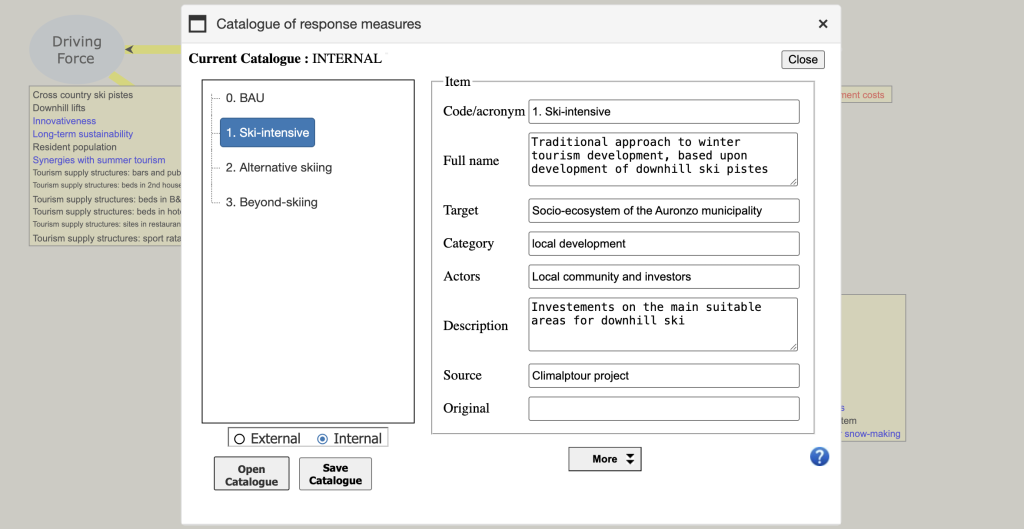
Similar to the indicators, the response measures (Options) are organized into External and Internal Catalogues, with the window structure mirroring that of the Indicator Window. For each response, the following details are provided: code, full name, target, category, involved actors, a brief description, and source. To save a response, all these fields must be completed.
The process of actions such as creating External and Internal Catalogues, modifying item details, saving, and uploading existing catalogues mirrors the steps reported for the Catalogue of Indicators.
From Scratch to Concept
This section outlines the key steps a user must follow to successfully complete the Concept phase and advance to the Design phase. The three available methods — MCA, MSS, and MSA — each have a distinct approach to these steps, shaped by the characteristics of the chosen method and the specific requirements of the software structure.
1. Multi-Criteria Analysis (MCA)
After starting a new scalar project and visualizing a DPSIR window similar to the one reported in Figure 7, the user should right-click on one of the DPSIR nodes and select Catalogue of DPSIR Indicators to display the Indicator Window, as shown in Figure 9–10. Following the outlined steps, the user can create a catalogue of indicators or upload and modify an existing one.
Once the Internal Catalogue is ready, with each indicator linked to the appropriate node, the user can close the Indicator Window. It is important to note that the final Internal Catalogue can be saved in a .xlsx file and easily uploaded in future sessions. This applies whether the catalogue was created within mDSS or developed externally in a .xlsx file, as long as it adheres to the software’s required structure.
After uploading the indicators, the user should right-click on the Response node and follow the analogous procedure to complete the Catalogue of Response Measures. As with the Internal Catalogue, it is advisable to save the Catalogue of Response Measures so that it can be easily re-uploaded in future sessions.
After completing these two steps, the DPSIR window will resemble the one shown in Figure 12.
The next steps involve the Design Phase, where the user identifies the criteria to be considered in the analysis and assigns values to each criterion for all available options. For a detailed explanation of the next steps, please refer to the following chapter.
2. Multi-Criteria Spatial Scenario (MSS)
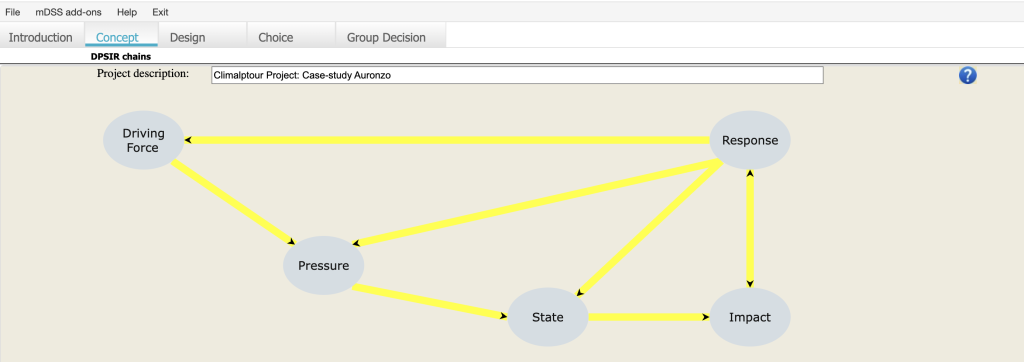
Once the three files are uploaded (.dbf, .shp, .shx), mDSS directs the user to the initial, empty DPSIR window, similar to the one shown in Figure 6. At this stage, the user needs to upload the Catalogue of DPSIR Indicators and the Catalogue of Response Measures, as described in the previous section. This can be done by right-clicking on one of the DPSIR nodes.
The key difference between the steps in the MCA case and the MSS approach (as well as the MSA approach) lies in the preparation required before initiating the mDSS session. For MSS, users must first define and prepare the indicators and options. This includes selecting the relevant indicators, specifying the options to be analysed, and assigning values to the indicators. This preparatory work is essential to ensure that all necessary data is available and properly structured for the system input. In contrast, in the Scalar context, users can define the indicators during the Concept Phase and assign values to them only during the Design Phase.
For MSS (and MSA), the selection of indicators, options, and values must be completed before the mDSS session begins. Importantly, mDSS does not require that all uploaded indicator columns be used in the quantitative analysis. It only requires that the relevant indicators intended for analysis be uploaded according to the specified procedure. For example, a user may upload in the .dbf file indicator columns for Biodiversity such as BIODIV_1 and BIODIV_2, but choose not to include them in the subsequent quantitative analysis.
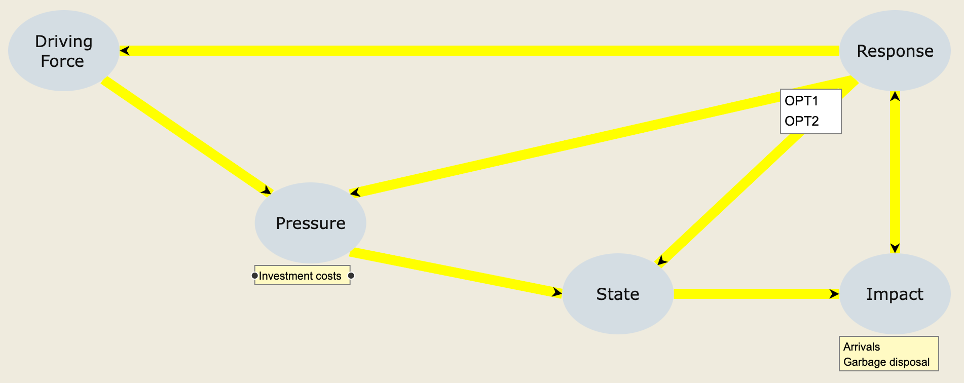
Once the Catalogue of DPSIR Indicators and the Catalogue of Response Measures are uploaded, the user will be presented with a Concept window similar to the one shown in Figure 13. At this stage, the two uploaded Catalogues are not yet linked to the .dbf file. At the beginning of the Design Phase, the user will need to specify to mDSS which column of the .dbf file corresponds to the “Investment costs” indicator for “OPT1” and which column corresponds to “Investment costs” for “OPT2,” as well as mapping the relevant columns for all other selected indicators. The steps to proceed with the Design Phase in the MOS case are outlined in the next Chapter.
3. Multi-Criteria Suitability Analysis (MSA)
After uploading the required file(s), mDSS presents the usual Indicator Window to the user, as illustrated in Figure 14. At this point, the user can upload a Catalogue of DPSIR Indicators from a .xlsx file. From this file, only those indicators with corresponding field names in the previously selected .dbf file will be selected. Importantly, in this window, only the “Internal” catalogue function can be chosen. This first step is optional, as the same operation can be performed later from the standard DPSIR window during the Concept Phase. If the user prefers to postpone this step, they can close the window by clicking the top-right button.
After completing the first step, mDSS will display a window similar to the one shown in Figure 15. The top section of the window features a tabular view of the uploaded .dbf file, with the names of the columns (representing the indicators) displayed in bold. The lower part of the window is divided into three sections, designed to assist the user in uploading the input parameters for the Multi-Criteria Suitability Analysis (MSA) in mDSS.
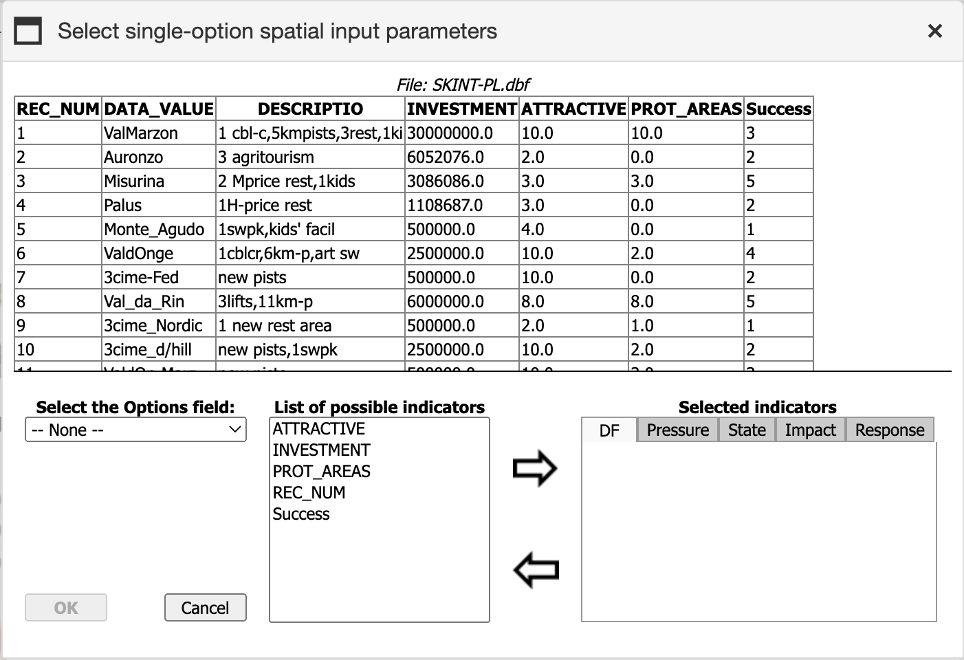
Firstly, the user must select the column containing the unique code that identifies the spatial object. This can be done from the menu under the label “Select the Options field”. For the Auronzo di Cadore case study, the column “REC_NUM” is selected, as shown in Figure 15, although “NAME” could also be a valid option.
To assign an indicator to the correct DSIR node, the user should first select it from the central list labelled “List of Possible Indicators.” Then, the user can click the right-directed arrow to move the indicator to the appropriate node. To choose the specific node for assignment, the user can navigate through the DPSIR menu under the label “Selected Indicators.” If the user wants to remove an indicator from a node, they can select its name in the right list and click the left-directed arrow.
The user can repeat this process and upload the choices made in this phase by navigating to the Main Menu and selecting File > Update Multi-Criteria Suitability Analysis (MSA).
Once the process is complete, the user can click the “OK” button to return to the standard DPSIR window. At this stage, the user can upload a Catalogue of DPSIR Indicators and/or a Catalogue of Response Measures. Once the Concept phase is completed, the user should see a DPSIR window similar to the one in Figure 16. To proceed to the Design Phase and access the Analysis Matrix, the user must click the “Design” button in the Tab Bar. Detailed instructions for advancing to the Design Phase in the SOS case are provided in the following chapter.